Overview
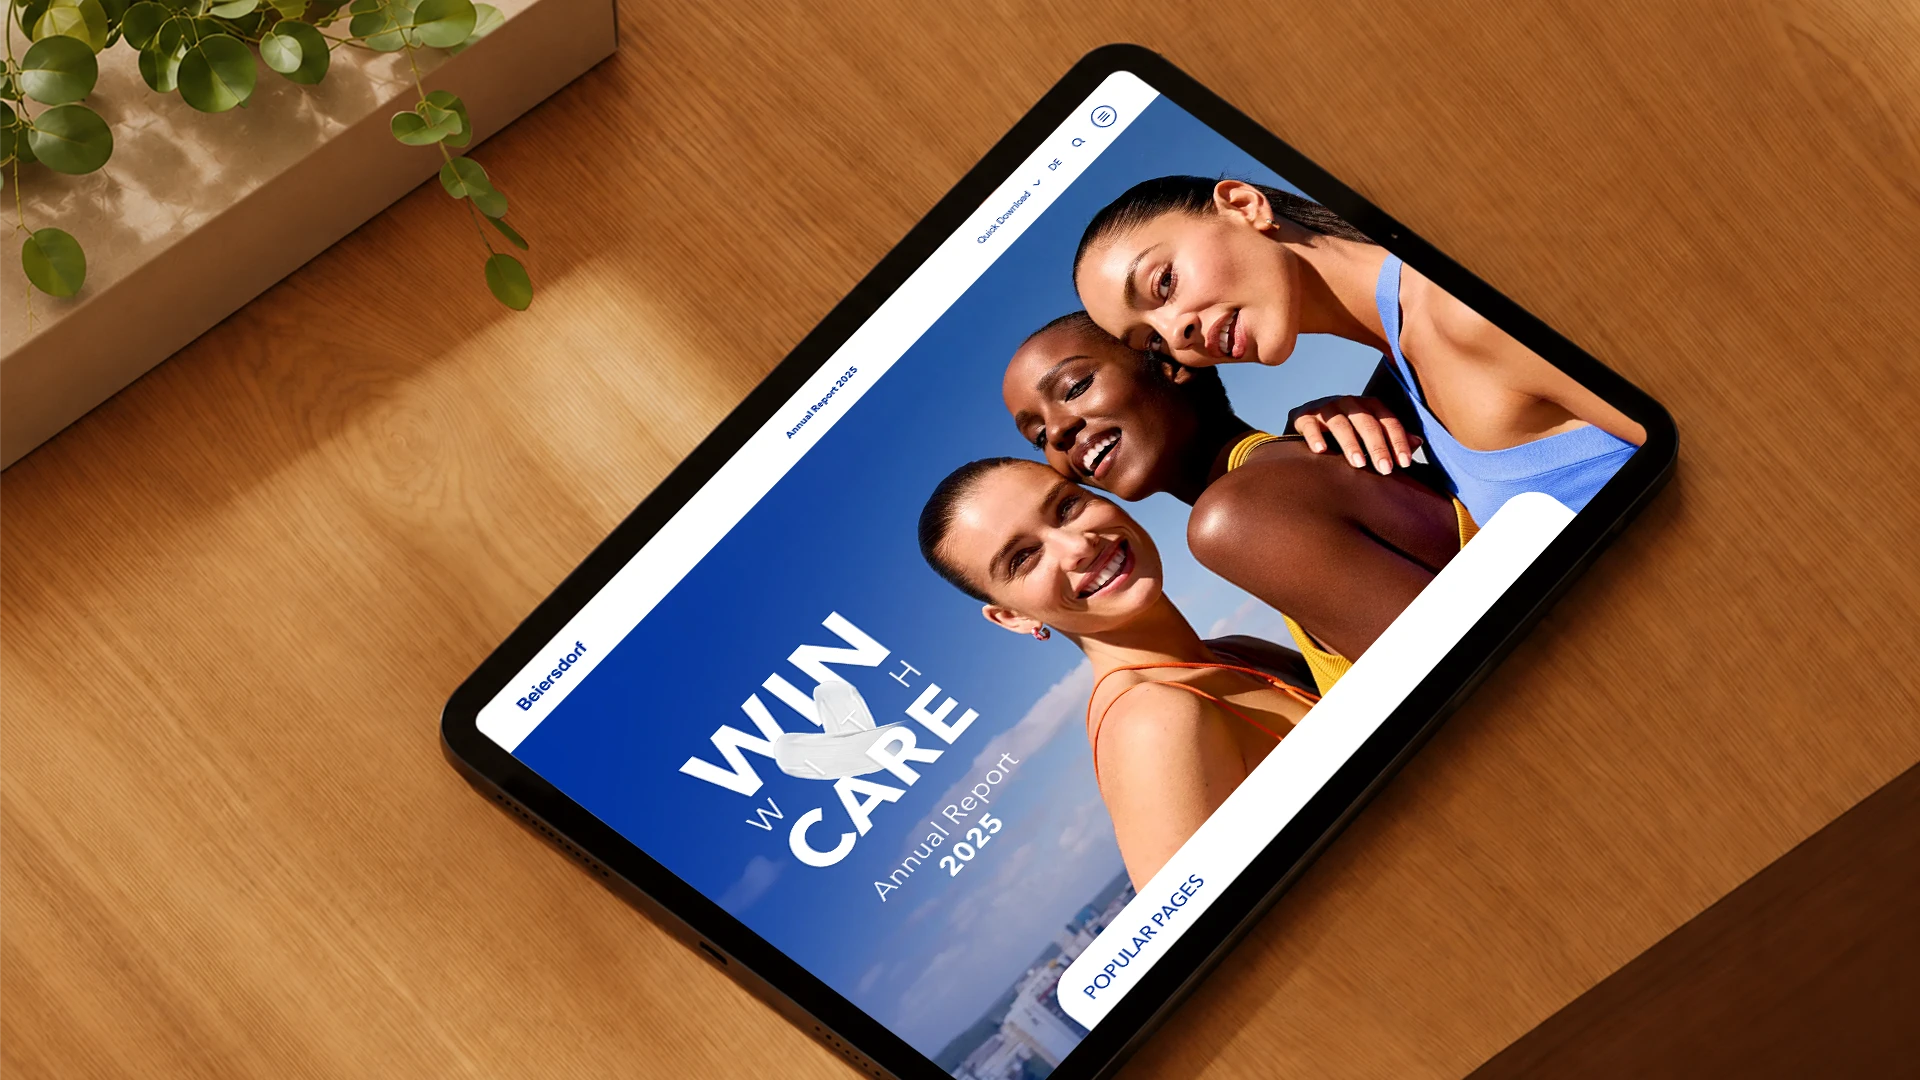
Beiersdorf Annual Report 2025 'Win with Care' cover open on a tablet resting on a wooden desk

Beiersdorf — Turning an annual report into an engaging digital experience

As Lead Designer for Beiersdorf’s annual report over three reporting years, I worked closely with the Corporate Communications team to highlight the company’s successes and goals and to translate complex financial and sustainability information into a clear and engaging experience across digital and print.

I developed a shared visual language and design system for both formats, creating a consistent experience for investors, media, employees and other stakeholders. Over three years, I evolved the report into a digital-first experience, introducing new features with each edition.
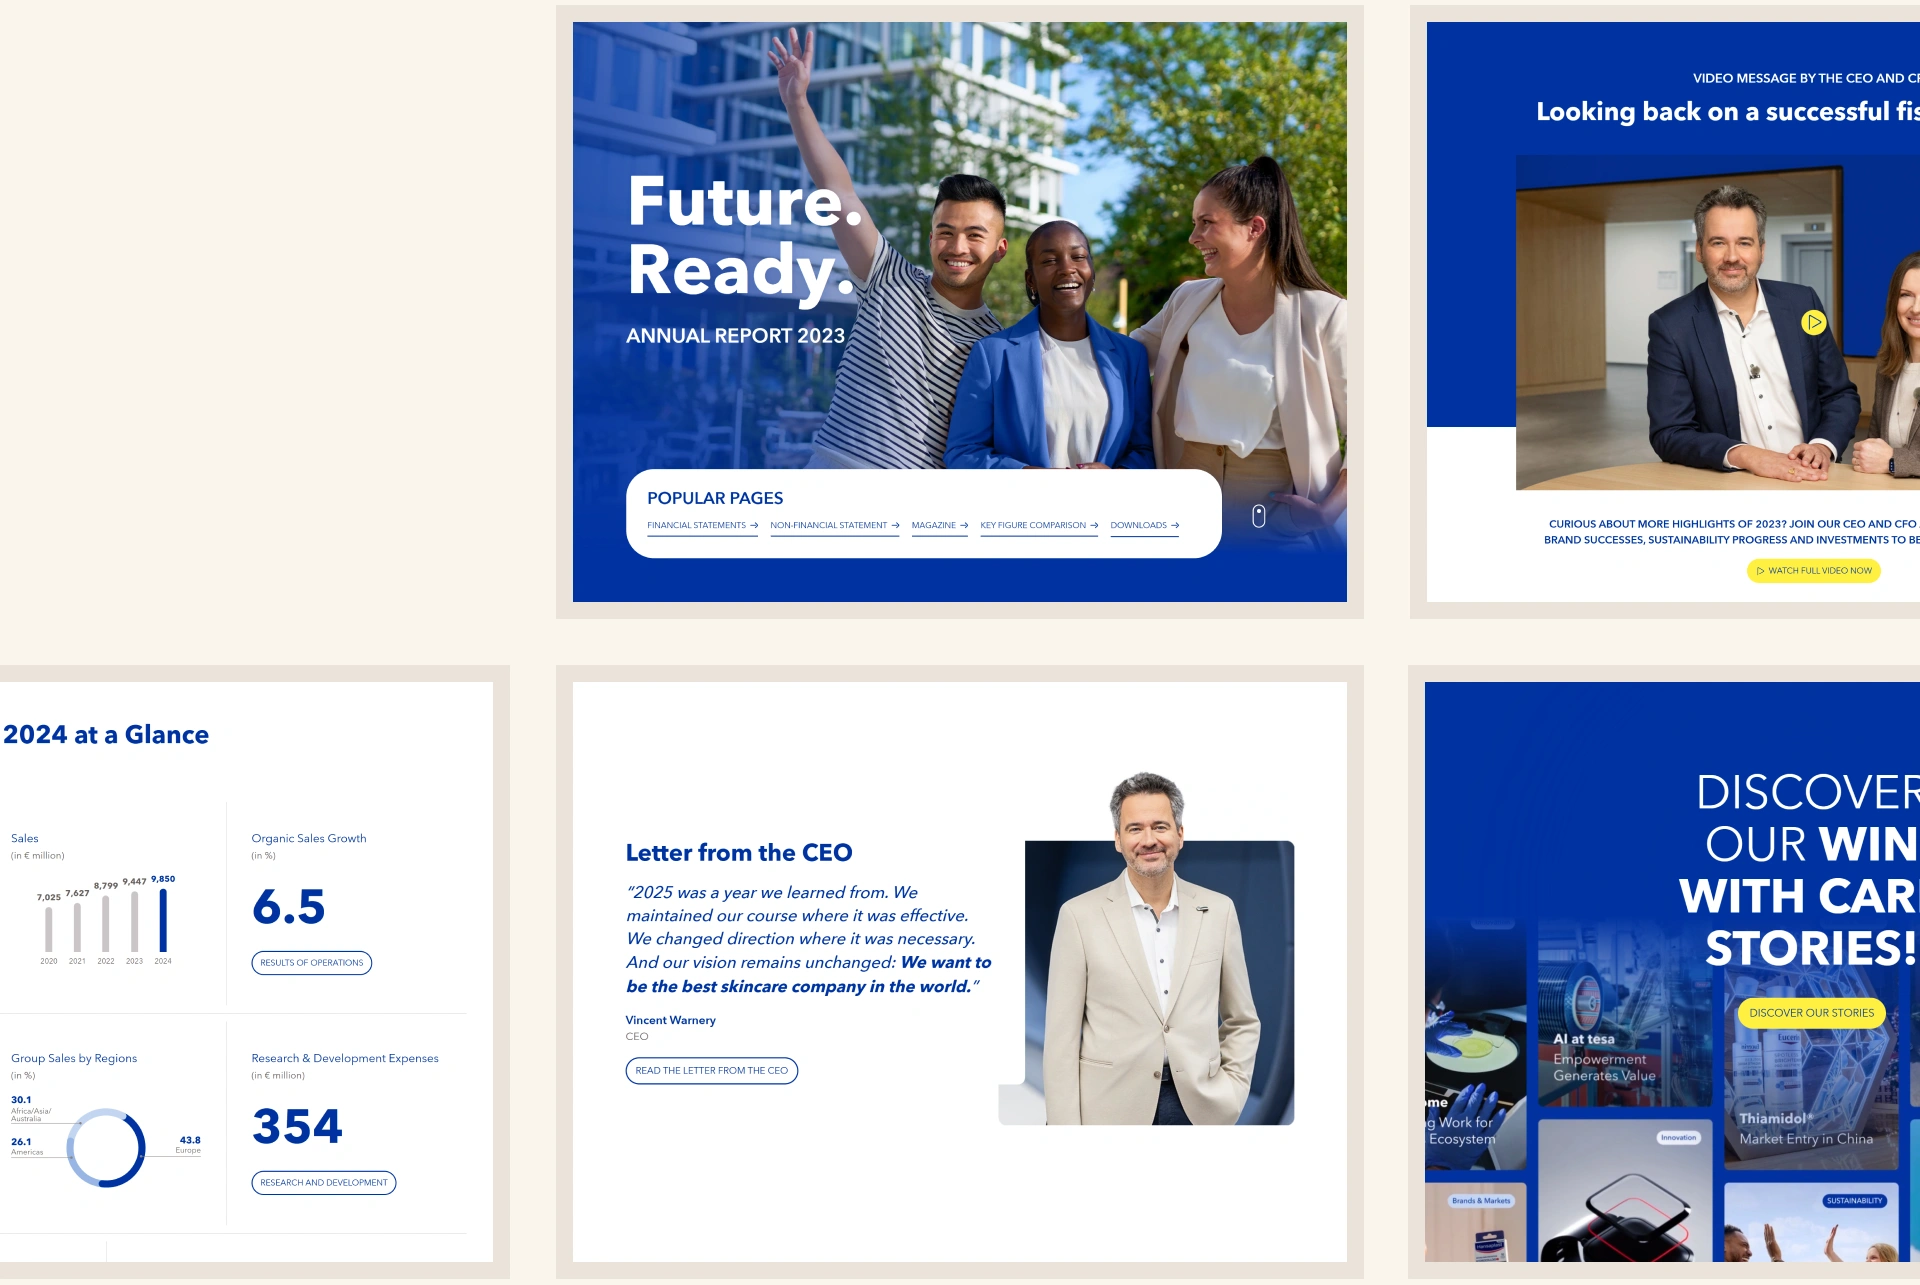
Collage of Beiersdorf annual report pages: the cover, a CEO video message, a key-figures overview and the CEO’s letter

Digital-first storytelling

I replaced a resource-heavy print magazine with a flexible digital storytelling system — easier to produce, more accessible to audiences and built to evolve.

As reporting requirements grew, Beiersdorf’s traditional magazine chapter in the printed report became increasingly demanding to produce.

I led the transition to a digital-first storywall — a more efficient and flexible way to tell stories beyond mandatory reporting.
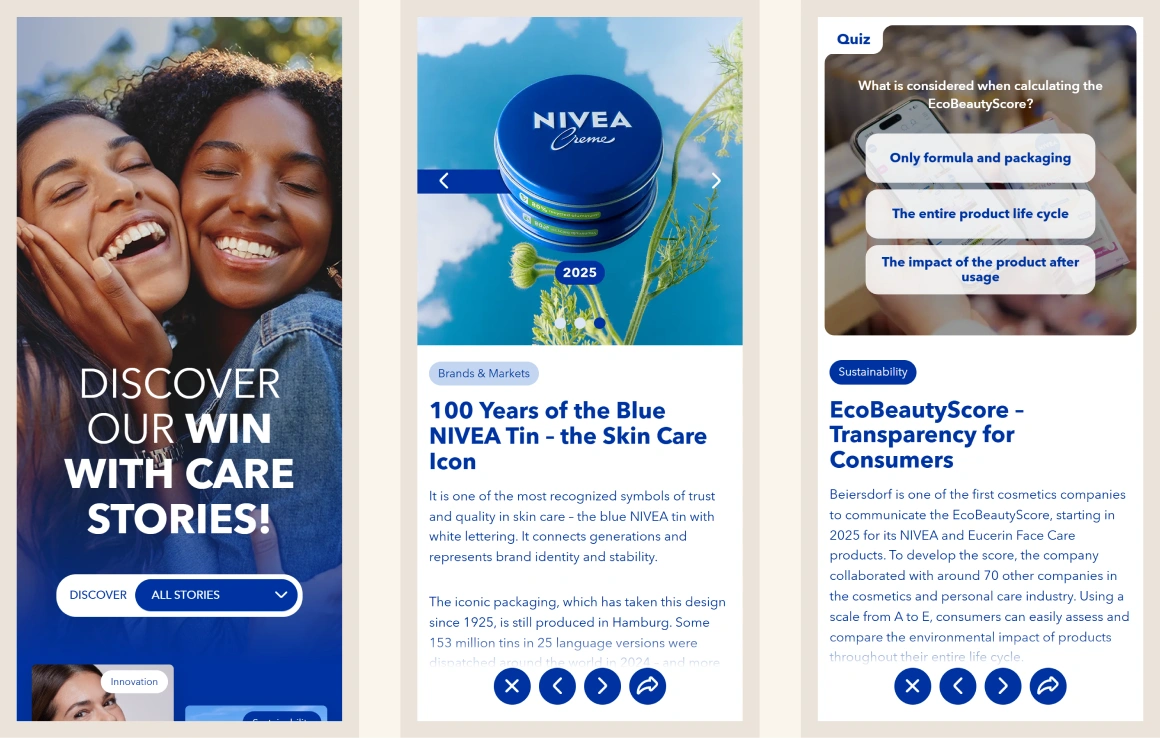
The storywall’s masonry grid of story cards — product, sustainability and market stories, each tagged by category
Drawing on familiar social patterns, I combined concise stories with sliders, video, animation and interactive quizzes to encourage exploration.

Sustainability Dashboard

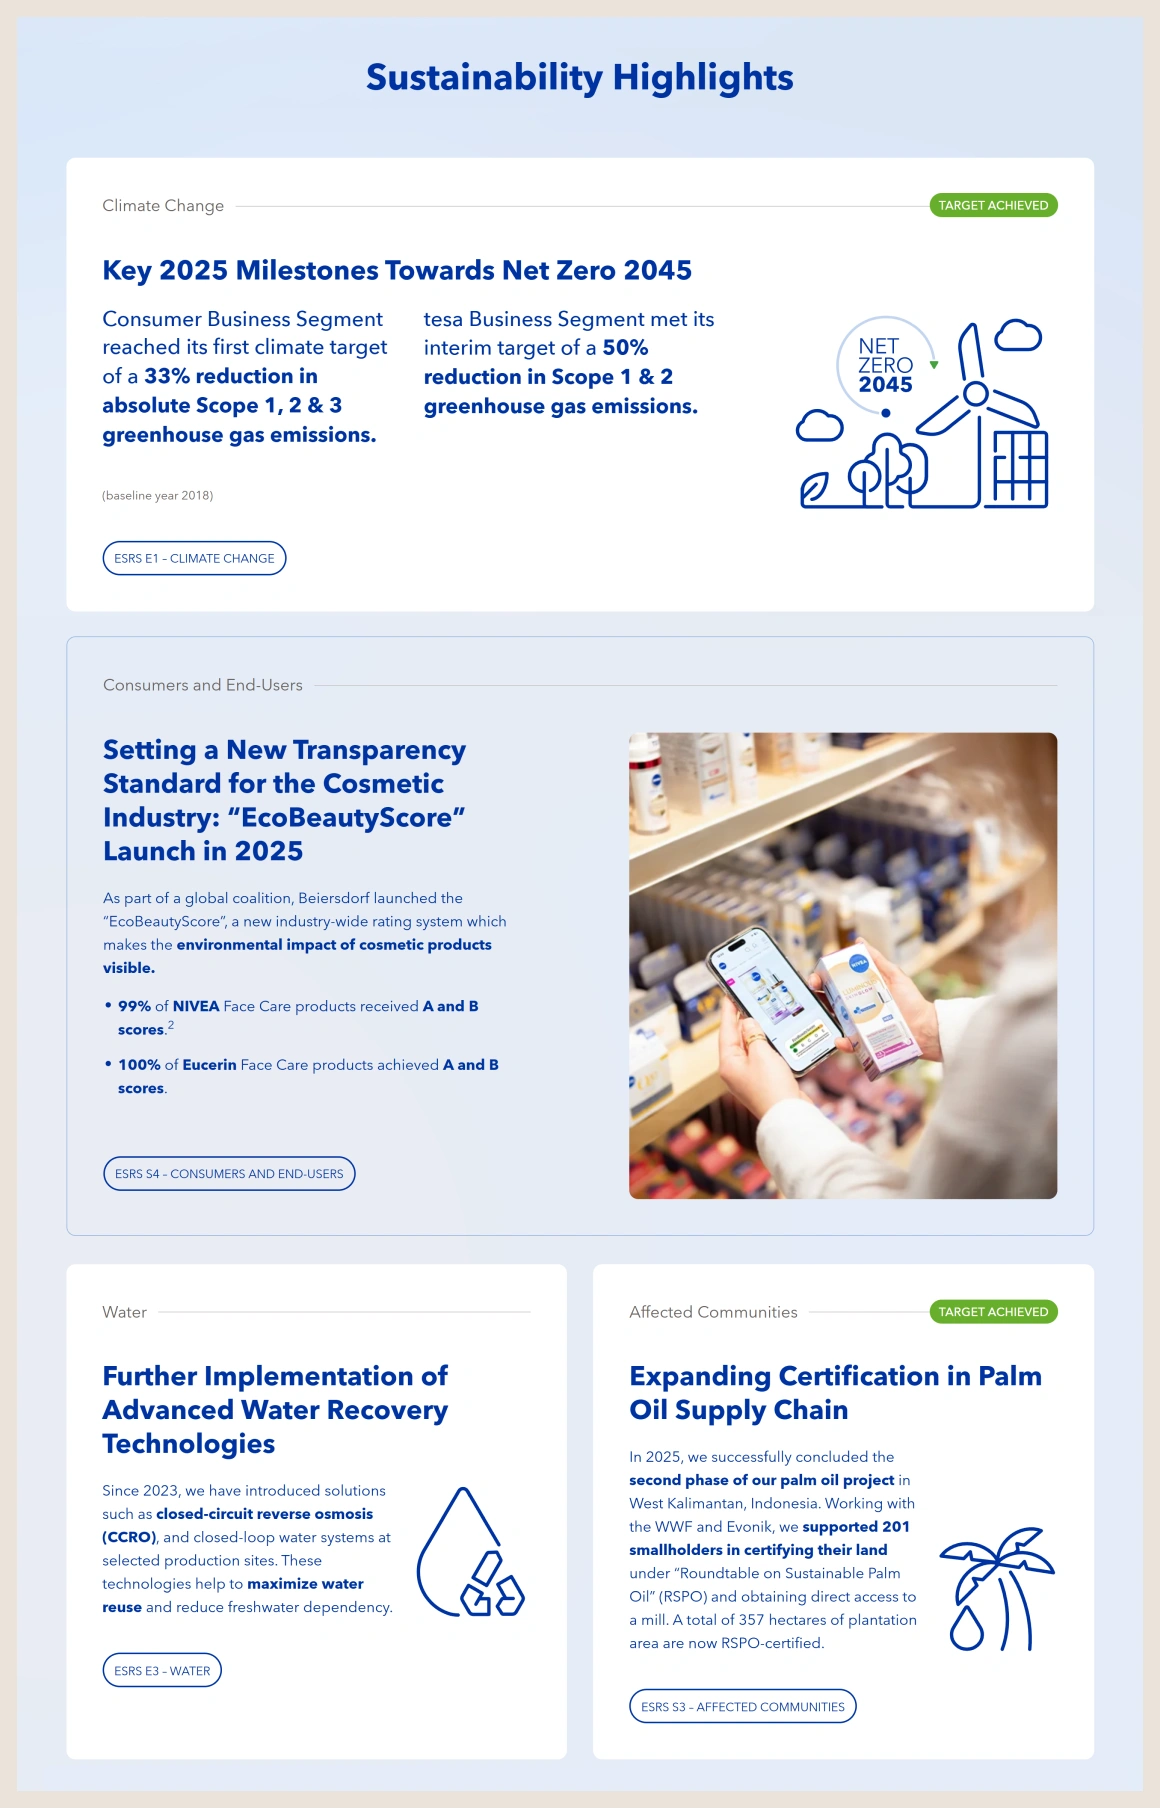
For the 2025 report, I created a sustainability dashboard that brings key topics and targets together in one place and provides direct access to the underlying content.

Sustainability dashboard: a climate-change card showing Net Zero 2045 milestones, an illustrated icon and a green 'target achieved' status
For the 2025 report, I developed a modular dashboard that brings key sustainability topics and targets into one accessible overview.

Clear hierarchy, animated icons and target statuses provide orientation, while deep links lead directly to relevant content.

Outcome

The result is an annual report made for digital — easier to navigate, more engaging to explore, and flexible enough to evolve with growing reporting requirements.

Keep scrolling to open the next case study